
Build reports from any data, summarize and chart them, or just ask in plain English.
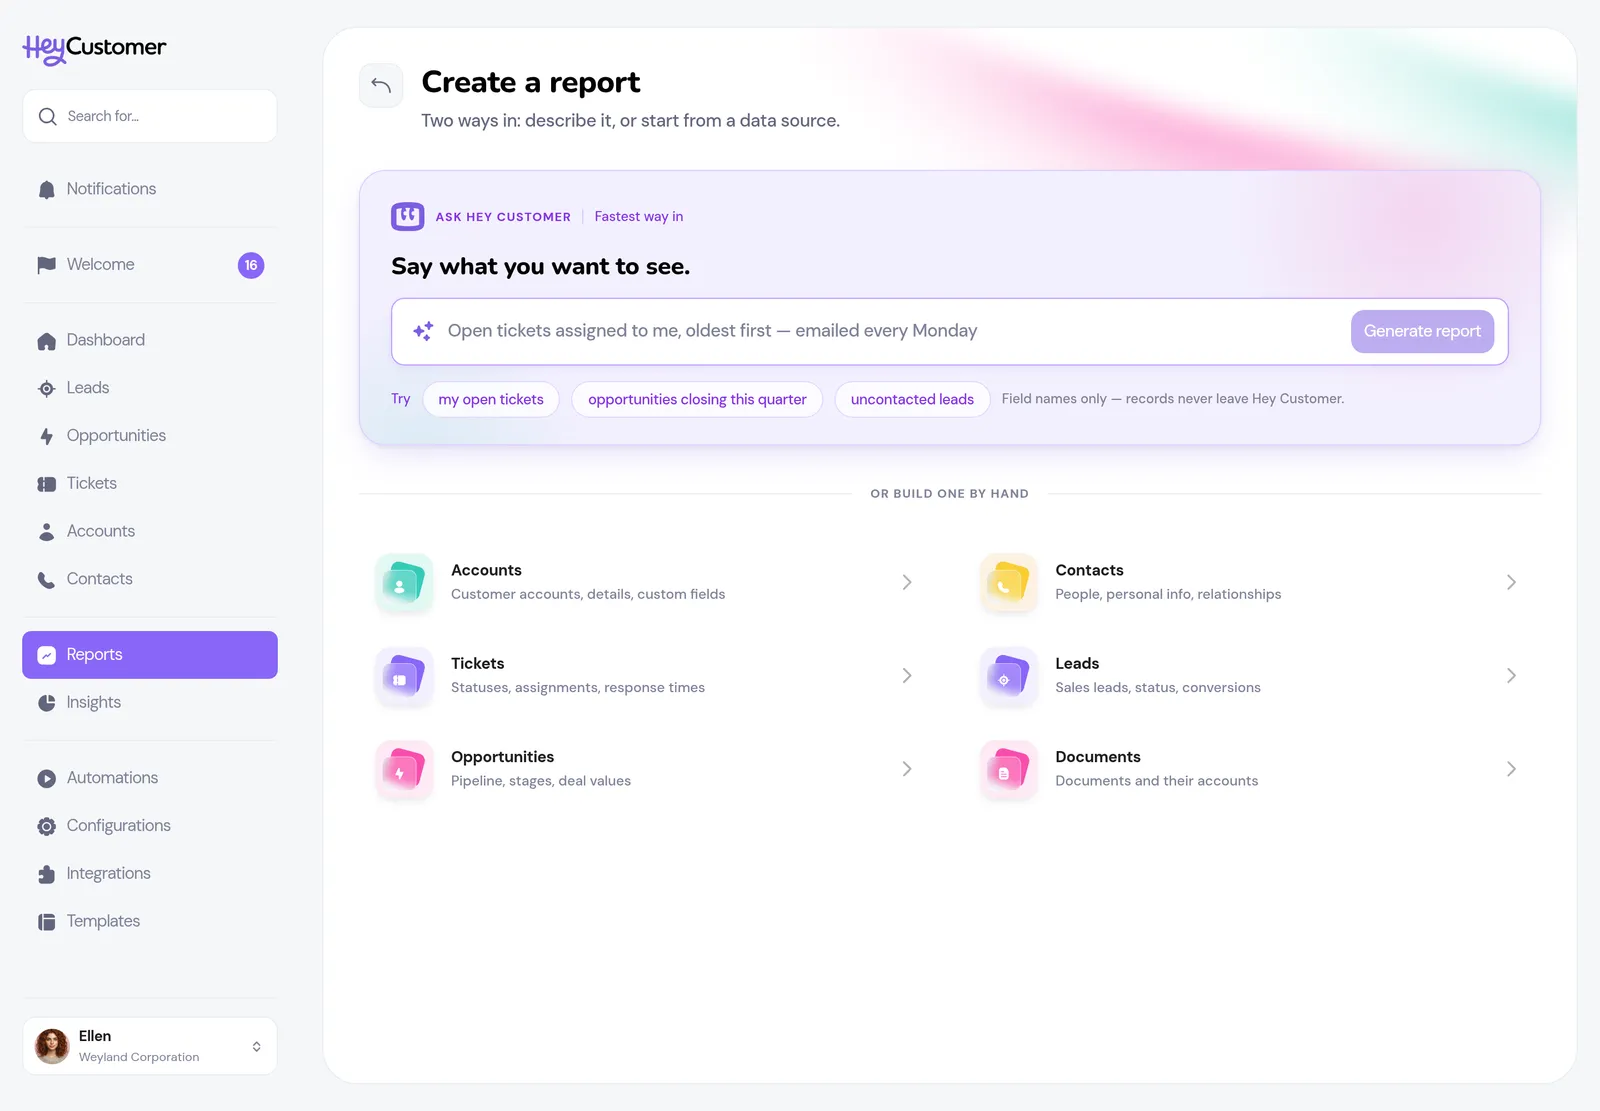
See where deals stall, which lead sources convert, and how you're tracking against your goals, without exporting a single CSV.
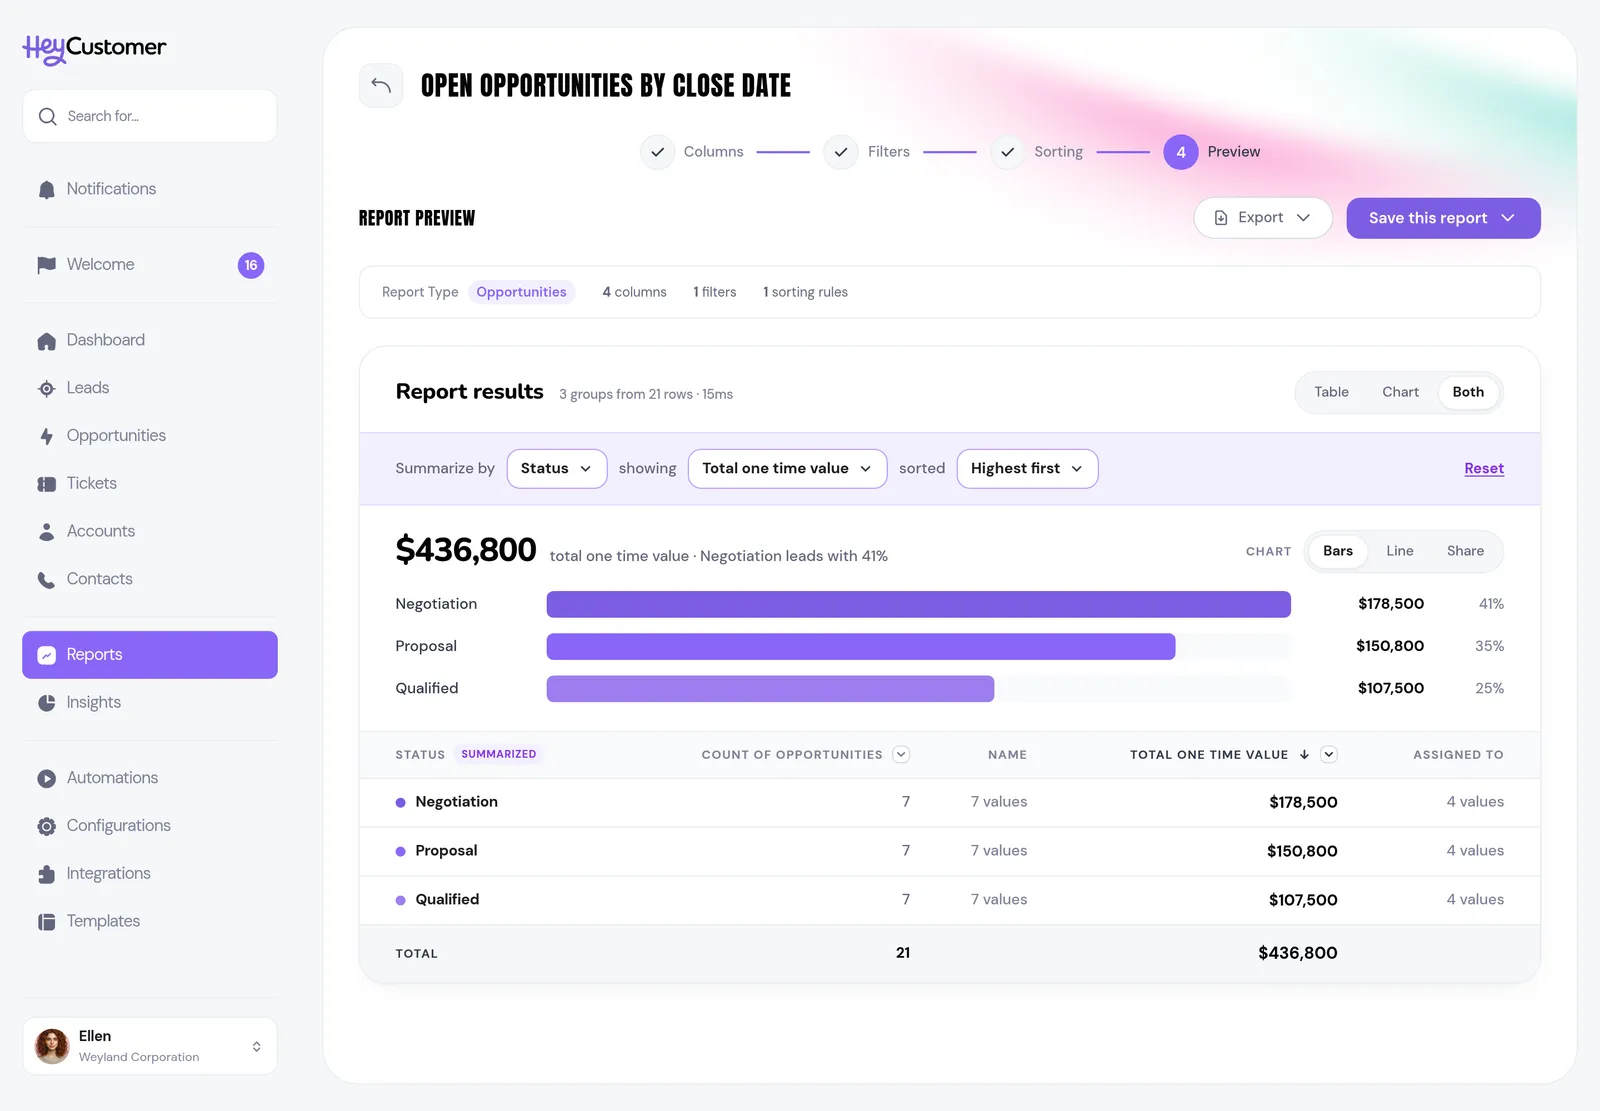
Build reports from any data in your CRM using joins and filters. Click any column header to total it, average it, or summarize by it: deals by stage, tickets by priority, revenue by month. A bar chart appears alongside, and clicking a bar shows the records behind it.
If the data is in Hey Customer, you can report on it.
Or skip the builder. Type what you want to know, like "open tickets assigned to me, oldest first," and Hey Customer builds the report for you.
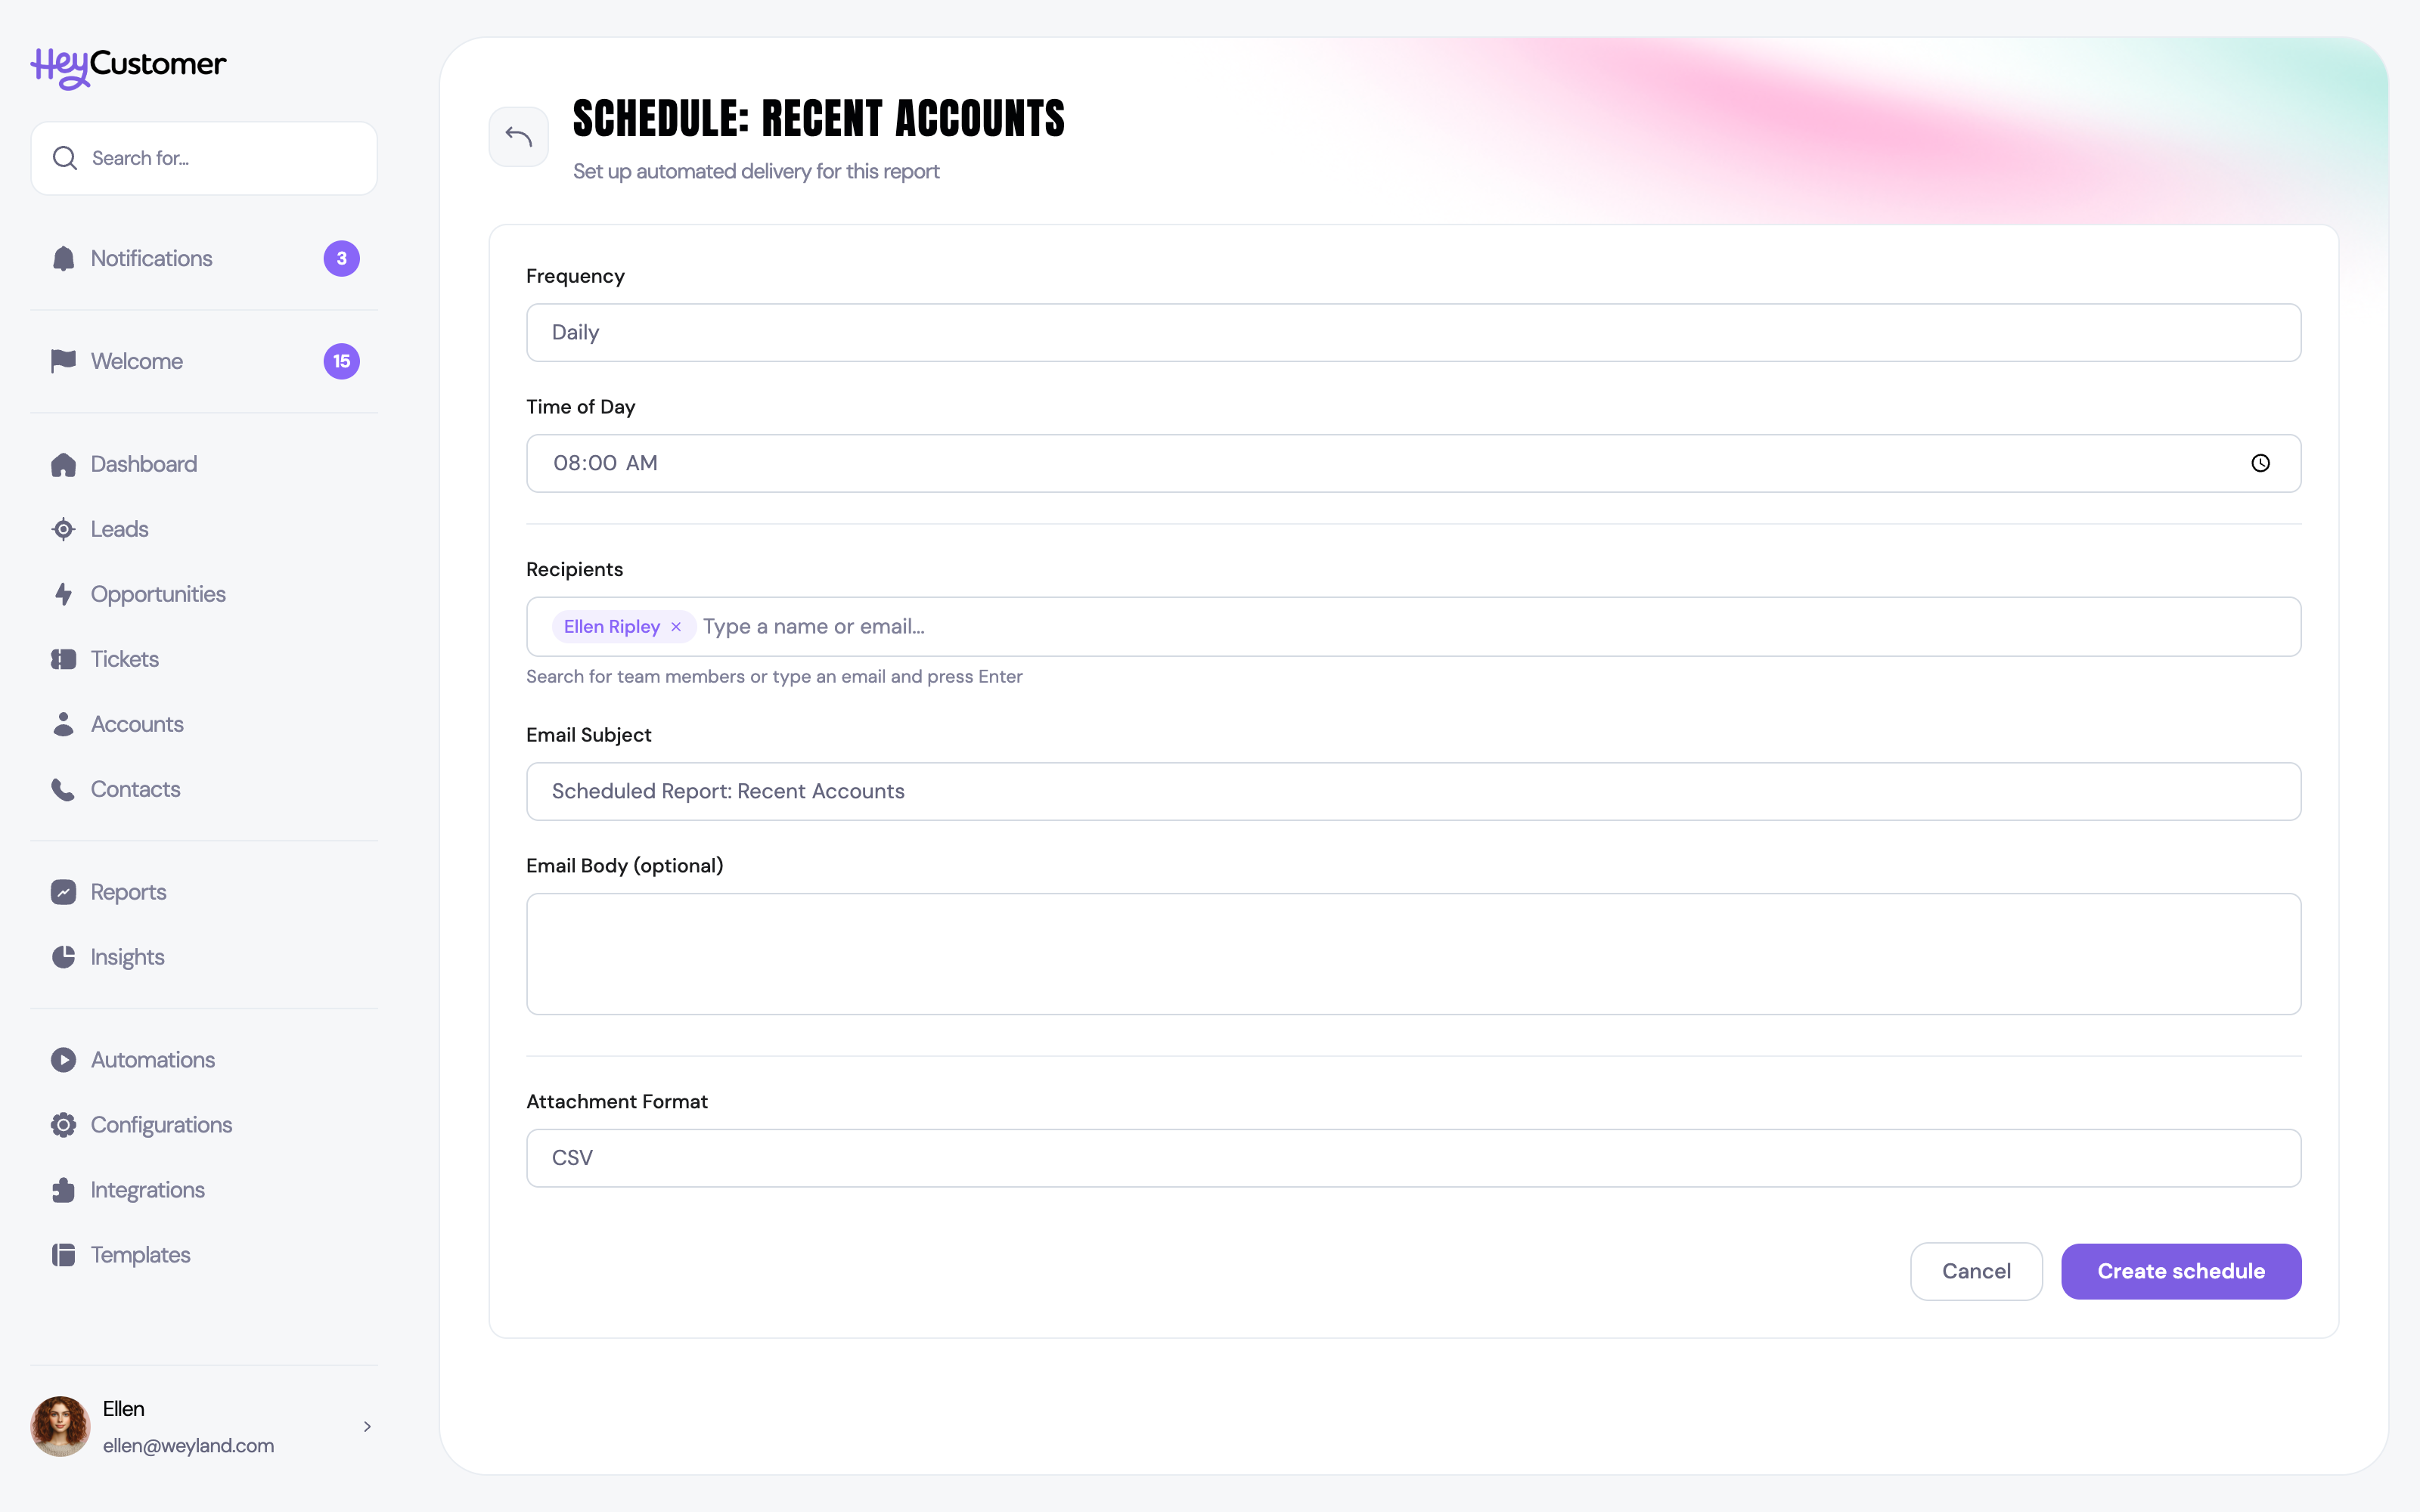
Schedule delivery straight to your inbox as PDF, Excel, or CSV, on whatever cadence you want. The Monday-morning report builds itself while you sleep.
Your leadership meeting starts with numbers instead of a scramble to assemble them.
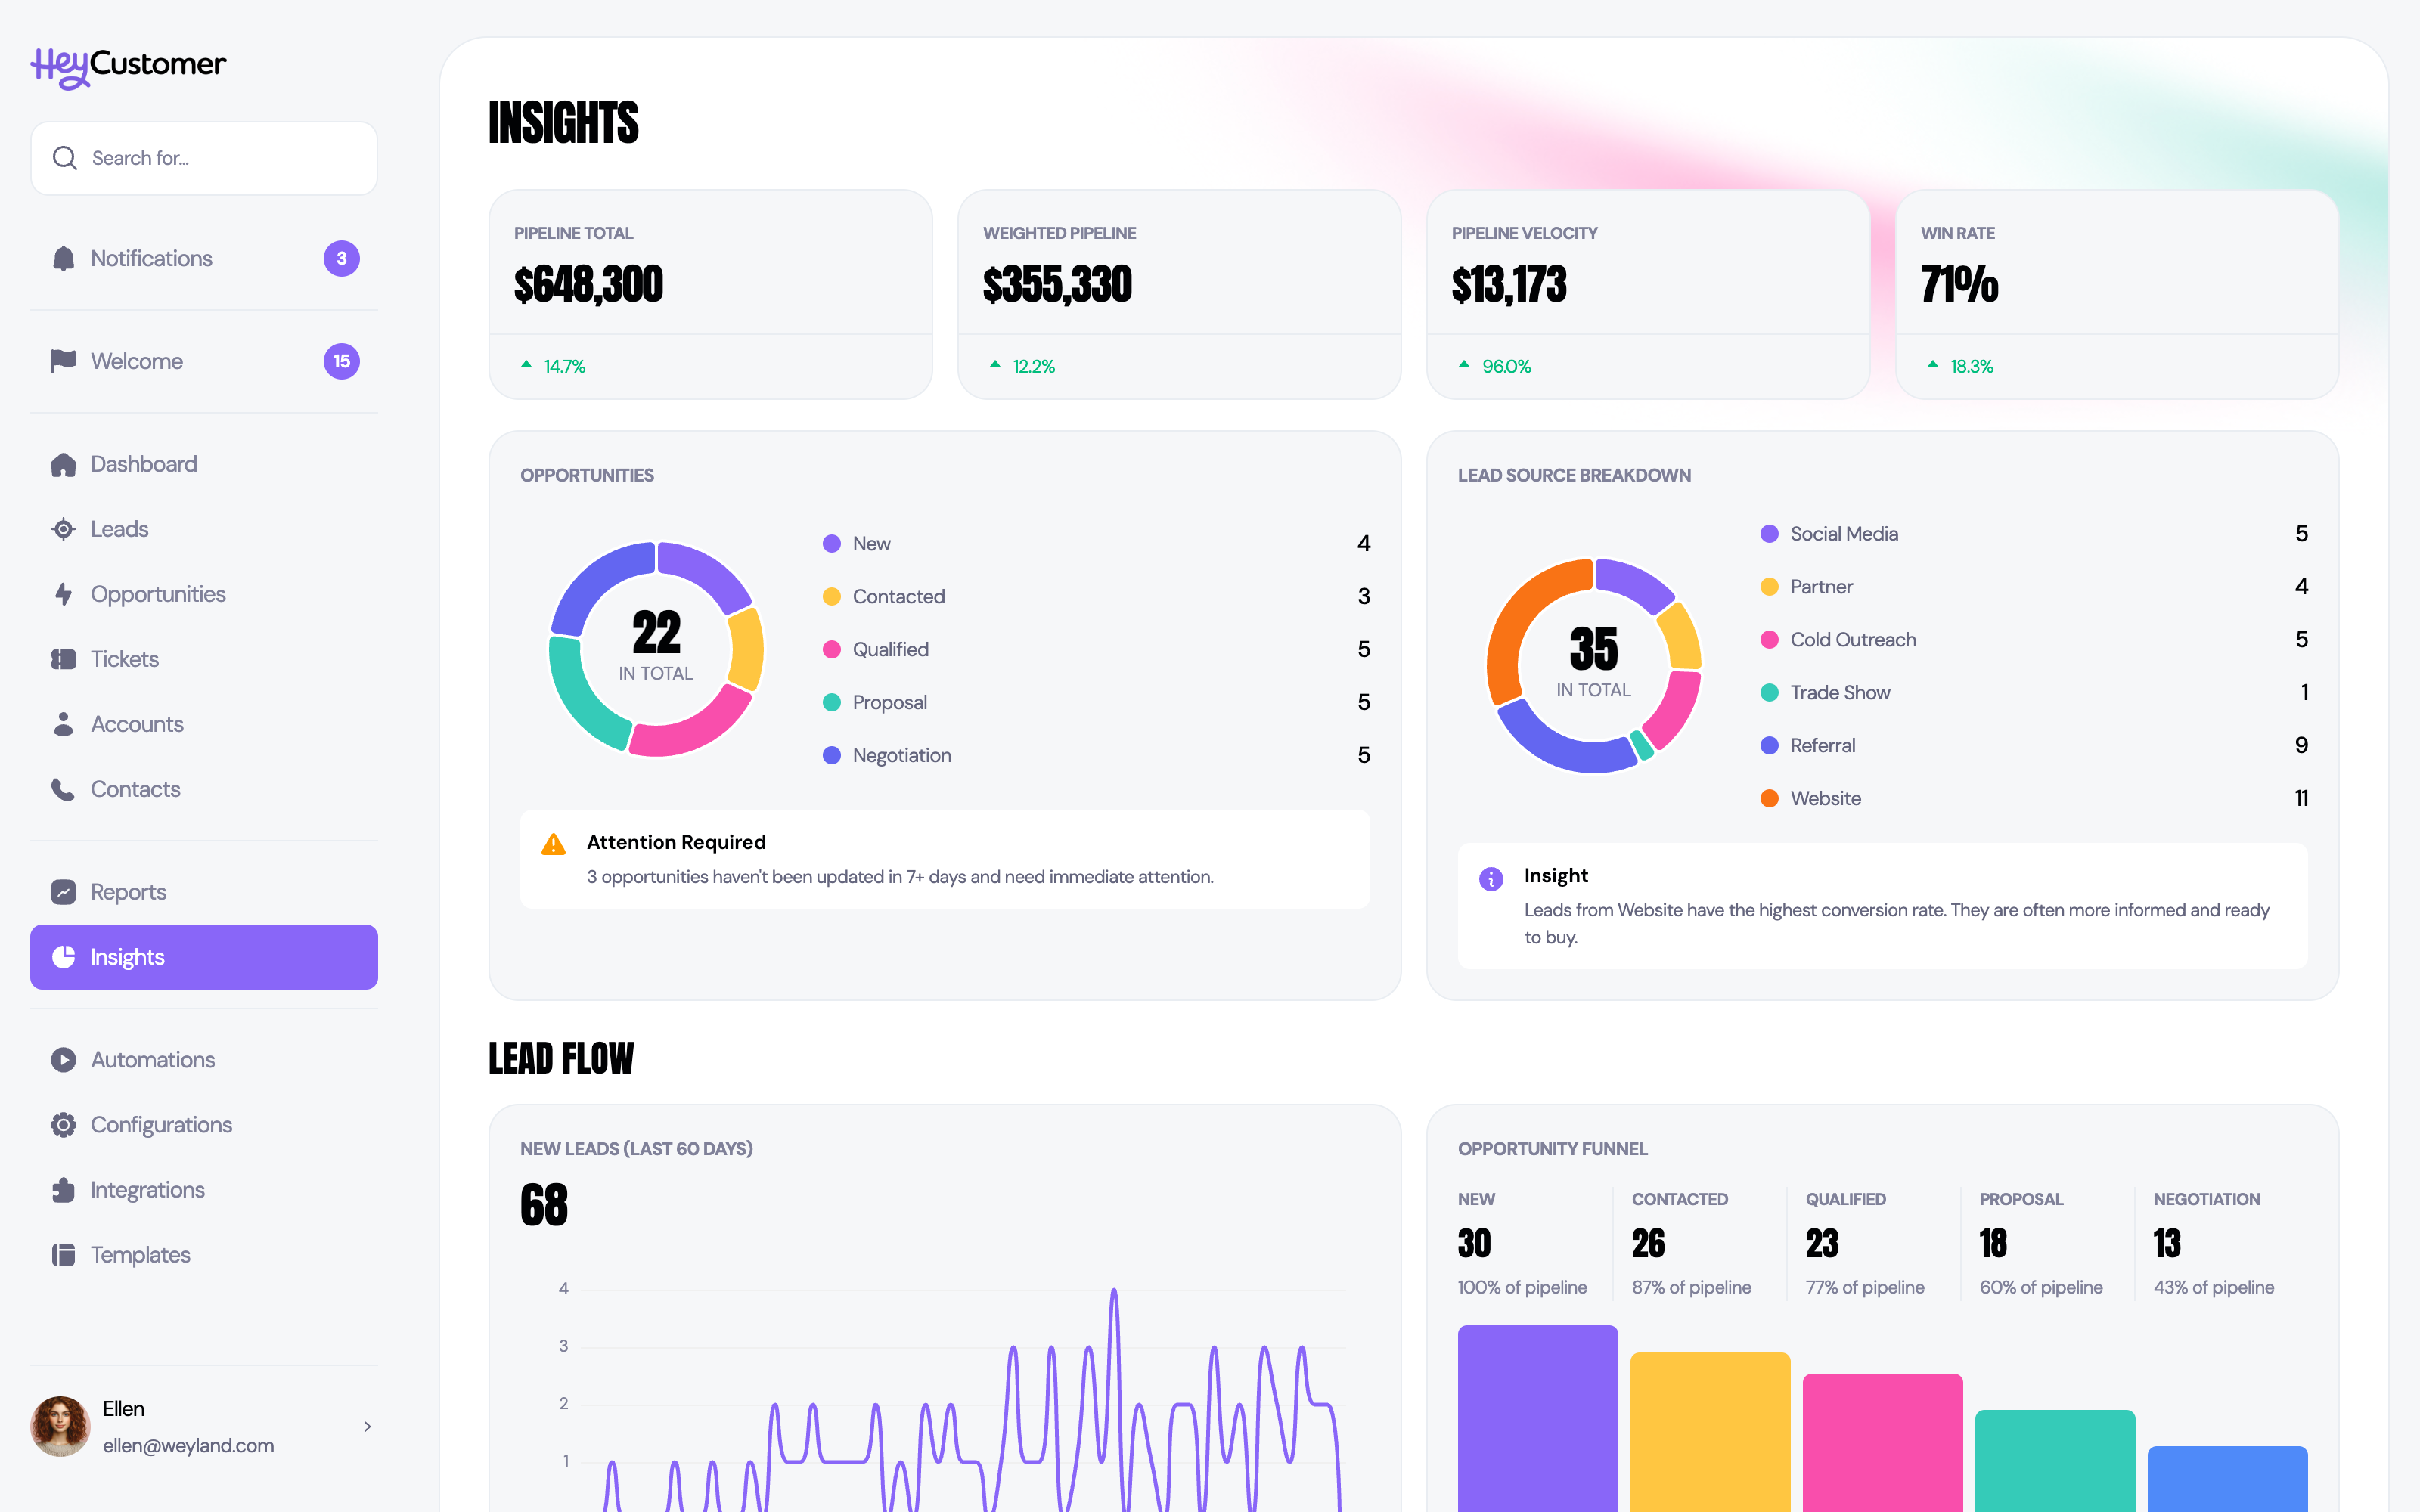
Dashboards give you a live view of pipeline health, ticket load, and team activity throughout the day, with one-time and recurring revenue tracked separately so you always know what lands once and what keeps coming back.
Decisions get made on real numbers instead of gut feel. And because reporting is included for every user, everyone works from the same truth.